Topographic Maps (Topo Maps) and Contour Lines
Topographic maps provide a detailed represention of the natural and man-made features of the earth's surface. The main characteristic of such maps is the representation of the three-dimensional terrain or relief of the surface of the earth by the use of contour lines. Topographic maps are a form of contour maps and the terms are used interchangeably.
Symbols and colors are used in topographic maps to identify cultural and natural features. For example cultural features can be roads, trails, buildings, boundaries, railways, power transmission lines, pipeline, campgrounds, mines, dams, recreation areas, ... . Natural features may include water (rivers, streams, lakes, wetlands and swamps, rapids), relief (mountains, valleys, canyons, and other landforms,...), vegetation (forested areas, cleared areas, orchards, ...). Toponomy or feature and place names are added to provide textual information about features.
Apart from the location map with symbols and contours, topo maps may also include map scale, legend, declination diagram, datum, projection, UTM zone, north arrow, production info, date of revision, and grid lines (e.g. UTM, latitude - longitude, Universal Polar Stereographic (UPS), or Military Grid Reference System (MGRS) coordinate systems).
Contour Lines - Isolines
Contour lines in topographic maps (topographic contours) are imaginery lines that connect points of equal elevation above a reference level (usually mean sea level). Each contour line corresponds to a specific elevation, therefore contour lines never cross each other (with the exception of representing overhanging cliffs or caves). Looking at a flat two-dimensional map with contour lines you can get a sense of the shape of the three-dimensional land surface (topography) such as mountains and vallyes. Representation of landforms and terrain features by contour lines is covered in depth in the next two sections. You will learn how to read and interpret topographic maps through examples.
Contour lines, isolines, or isograms are used widely in different fields such as meteorology, geology, oceanography, and other sciences to represent lines with equal values of a certain attribute. Examples include: an isobath connects points of equal depth under water; an isobar connects points that have equal amount of pressure; an isotherm connects points of equal temperature; an isohyet connects points that have an equal amount of precipitation during a certain period. You can find more examples of isolines in this website.
In these images, a hill (three-dimensional feature) is represented by a two-dimensional contour map.
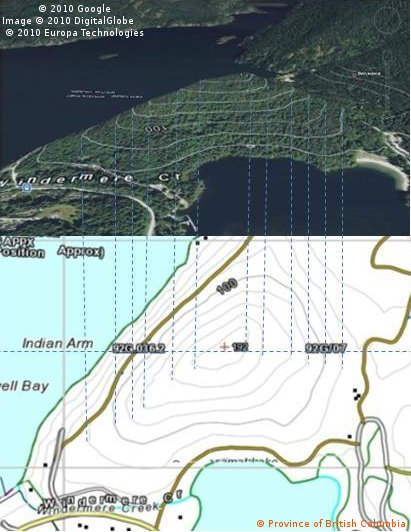
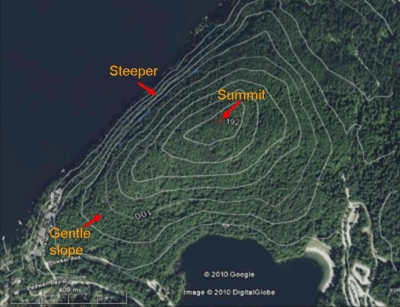
A series of concentric closed contours (i.e. irregular circles) are used to represent hills, mountain summits, knolls, horns, etc. Contour lines with wider spacing represent gentle slope, while the closer spaced contours indicate steeper terrain. Evenly spaced contours represent a uniform slope.
Specific elevation of certain points (e.g. summit, ridge line, right of way, lake surface, depression, etc.) on topo maps may be indicated by benchmarks or spot elevations. Benchmarks are established using ground based surveying. On the ground a benchmark is usually marked with an engraved brass plate indicating the height above mean sea level of that location. Benchmarks are used as reference points in surveying. In USGS topo maps bechmarks are indicatd with letters BM and black cross. A spot elevation is usually indicated on topo maps by a cross, a dot or an X. Spot elevations are less accurate and precise than benchmarks, however they are more accurate than contour elevations. In the above topo map, the summit of the hill is marked with a 192m spot elevation.
Contour Interval - Types of Contour Lines: Index, Intermediate, Supplementary
The elevation difference between two adjacent contour lines is called the contour interval (CI). Usually the contour interval is noted on the map legend. In most topographic maps every 5th contour line is drawn in bold print or wider than other contours. Such lines are called index contour lines. They are usually labeled with their corresponding elevations. Contour lines (thinner lines) between index contours are called intermediate contour lines. In the map shown below, the elevation difference between index lines is 100 meters. The elevation difference or vertical distance between two adjacent contour lines would be 20 meters (100 : 5 = 20). Therefore the contour interval is 20 meters.
In some situations the elevation and terrain relief can not be shown with enough detail using index and intermediate contours using the standard contour interval. This is more often seen in very flat areas with minimal change in elevation where the spacing between contour lines becomes very wide. In such cases, supplementary contour lines in the form of dashed lines are used to provide more information about the topography and help in detecting small changes in elevation. The contour interval for supplementary contours in usually half the regular contour interval. For example in the above case where the contour interval is 20m, the distance between a supplementary contour line to the closest contour would be 10m. Typically the interval used for supplementary contours is noted next to the regular contour interval in the map legend. Hachured contour lines are another form of contours used to depict terrain depression, and are explained in a future section.
How to read topographic maps
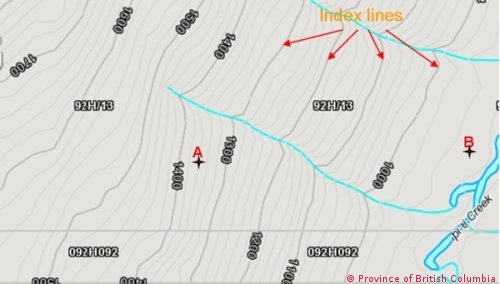
Reading topographic maps entails estimation of the elevation of desired locations on the map as well as acquiring a feel for the three dimensional relief, and shape and location of the terrain features. Labeled contour lines along with the contour interval can be used to derive the elevation of a location. To find the elevation of point A we can start from a labeled line and count the number of intermediate lines to get to the point or near the point. Starting from the 1400m line moving right toward point A there is a loss of elevation, since we are moving toward 1300m elevation. The first contour adjacent to 1400m is 20m lower (i.e. 1380m) and for the next contour there is again a loss of 20m. Therefore point A sits at 1360m. Alternatively we can start from 1300m and add 20m for every contour until we reach point A. There are 3 contours with each having 20m elevation change. Therefore 3 x 20m = 60m elevation change. Point A is at 1300m + 60m = 1360m.
Point B is located between two contour lines, therefore its elevation is somewhere between the elevations of the sorrounding lines. Moving right from the 1000m line the elevation decreases, the elevation of Point B can be estimated as around 950m (between 960m and 940m).
Always consider the shape of the terrain when finding elevations of desired locations by successively adding/subtracting countour line elevations. In many cases moving across the map the same elevations are encountered more than once. Such scenarios can happen for example when moving up the slope of a mountain to a ridge line or a pass and coming down the other side, or traveling across a valley bottom.
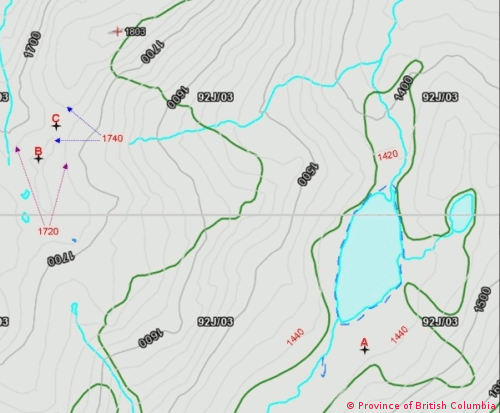
In this image point A is clearly located on the bottom of a valley south of the lake. Carefully looking on both sides of the point we can locate the 1500m labeled contours. Moving down three lines from the index contours, we find the elevation of contours adjacent to point A to be equal to 1440m (3 x 20m = 60m; 1500m - 60m = 1440m, numbers in red are added to the map). There are no other contours on the valley bottom below 1440m (the next contour lower than 1440m would be 1420m), therefore the valley bottom should be between 1420m and 1440m elevation. Point A's elevation can be approximated to be somewhere in 1430s meter range. Looking north of the lake we can see the elevation gradually decreasing as the river originating from the lake moves downstream. The next contour line (1420m) is located just north of the lake.
Climbing up from the valley toward west (left of the map) elevation of 1700m is reached. Considering the shape of the terrain, there seems to be a broad ridge to the south of 1803m peak (indicated with spot elevation), point C lies on a small pass or col and point B is located on a ridge or broad peak south of the pass. It is clear that by traveling from east to west elevation has increased, and after the pass the elevation drops back down to 1700m and possibly lowers more on the west side of the mountain. Looking at 1700m contour on both sides, elevation of the intermidiary contours are found conveniently. Point B is sorrounded by the 1740m contour line. There is no other contour line above this line (next one would be 1760m elevation), therefore point B should be somewhere between 1740m and 1760m elevation. We can approximate it as around 1750m.
Point C is sorrounded by four contour lines. From east 1720m contour elevation rises up to point C and drops back down to 1720m on the west. From south 1740m contour elevation drops down to point C and rises back up to 1740m to the north. Therefore point C should be somewhere between 1720m and 1740m elevation.
Also note that if a feature such as a small cliff is shorter than the contour interval, then it may not be shown on the map. For exmaple a 15m high cliff may not be detected on a 40m contour interval map.