Slope Calculation from Contour Lines in a Topographic Map
Slope is the measure of steepness or the degree of inclination of a feature relative to the horizontal plane. Gradient, grade, incline and pitch are used interchangably with slope. Slope is typically expressed as a percentage, an angle, or a ratio. The average slope of a terrain feature can conveniently be calculated from contour lines on a topo map. To find the slope of a feature, the horizontal distance (run) as well as the vertical distance (rise) between two points on a line parallel to the feature need to be determined. The slope is obtained by dividing the rise over run. Multiply this ratio by 100 to express slope as a percentage. The slope angle expressed in degrees is found by taking the arctangent of the ratio between rise and run.
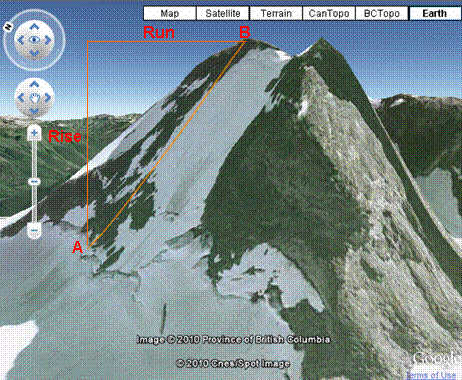
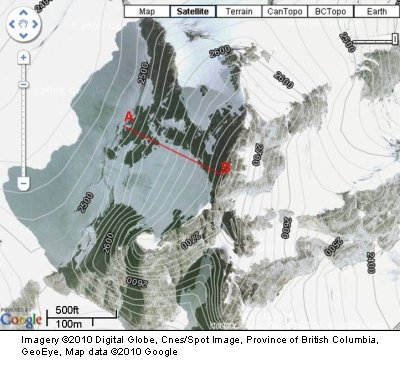
Here we want to find the average slope of the face of this mountain (the section from point A to point B). The vertical distance or rise is the elevation difference between point A and point B. Checking the topo map below Point A is at 2500m. Contour interval is 20m (five contour lines per 100m elevation difference). Therefore elevation of point B is 2780m. Rise = 2780 - 2500 = 280m.
The run or the horizontal distance between two points is found by using the map's scale bar. Using a ruler we can measure the scale bar of Google Maps at bottom left corner. 17mm or 1.7cm on the map is equal to 100m in the real world. Again using a ruler, the next step is measuring the horizontal distance between point A and point B on the map: 42mm or 4.2cm. Calculating the real world distance: Run = 4.2cm * (100m / 1.7cm) = 247m. (Note that the numbers corresponding to measurements on the image may be different on your computer monitor due to resolution difference or when the image is printed. The end result however should be the same).
If no ruler is available for exact measurements, you can always use any straight-edge object or the side of your finger. Mark the length of the scale bar on the straight edge, and compare the scale bar length to the distance along the line between two points on the map. See how many scale bar lenghts or its portion will equal the distance between the points. An approximate direct distance measurement will be obtained conveniently. For example here the distance between points A and B is about two and a half times the distance on scale bar that corresponds to 100m. Therefore the desired map distance is approximately 2.5 x 100m = 250m.
Gradient (decimal) = Rise / Run = 280m / 247m = 1.1336
Here for every 1 unit (e.g. meter, foot, etc.) of horizontal travel, there is 1.1336 units of altitude gain. Alternatively for every 0.882 unit horizontal travel, there is one unit of vertical gain.
Therefore as a ratio, the gradient would be expressed as (1 in 0.882).
Gradient (percentage) = 1.1336 * 100 = 113.4%
Slope angle is the angle α in the diagram. By definition of tangent in trigonometry: tan α = Rise / Run
Therefore having the values for rise and run, value of α in degrees is determined by taking the arctangent (tan-1) of the ratio: α = arctan(280/247) = 48.6°
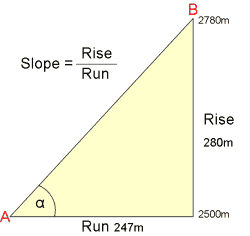
The distance of travel (distance along the slope or hypotenuse of triangle) is obtained from the Pythagorean theorem equation: (hypotenuse distance) 2 = 2472 + 2802. Distance along the slope is equal to 373m.
So keep in mind that the distances found on map using the map's scale are the horizontal distances (straight distance as the crow flies). If you plan to do a long traverse in mountainous terrain, your actual travel distance will be much longer than the one calculated with the scale bar. To get a more real distance of travel, the distances along slopes will need to be taken into account as above. Inclinometers (clinometers) are used for direct slope measurements in field work such as forestry, terrain mapping, avalanche safety, etc. Many modern compasses include inclinometers.
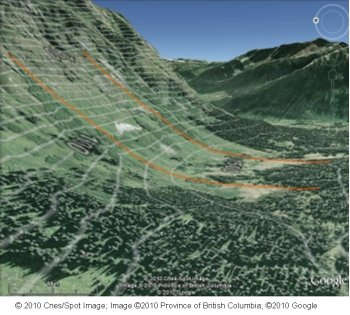
Note: top down (2D) satellite map with overlaid contour lines is used here for clarity. Exactly the same procedures as above are used with a regular topographic map to find the desired parameters.
The above value is the meseasure of the average slope for the distance between two points. In reality parts of the slope are steeper and parts gentler than the average slope. The terrain most often is not a naturally smooth surface and there are usually sections with varying slopes. Also features such as cliffs, convex rolls, knolls, dips, benches, etc. that are smaller in size than the contour interval might not show up on the topo map. For example you may be travelling on a 35° slope and come across a 10m cliff band, while the topo map shows a constant 30° to 40° slope. Terrain assessment and getting a feel for the slope from contour lines (without measuring) comes with experience. Sometimes measuring sections of the whole slope is required, such as in avalanche terrain mapping where slope angles for the start zone, track and run-out zones are measured seperately and a profile for the avalanche path is drawn.
Some slope features are important in field studies like geomorphology, avalanche and backcountry travel decision making. Examples include convex and concave slopes. Convex slopes roll from less steep to steeper terrain. Depending on the contour interval and the size of the feature, convexities on terrain may be detected by wider contour spacing on top and closer contour lines on the bottom of the roll.
Concave slopes go from steeper to gentler terrain with movement downslope. There are closer contour spacing at the top and wider spacing at the bottom of the concave slope.